 Skip to content


Sign of an upcoming recession?
The US stock market has enjoyed a 10 year bull market (a period where share prices are rising), the longest in history. But recently, there have been signs (an escalation of trade and currency tensions with China, for instance) that a recession might be on the horizon.
The Yield Curve as a Leading Indicator of a Recession
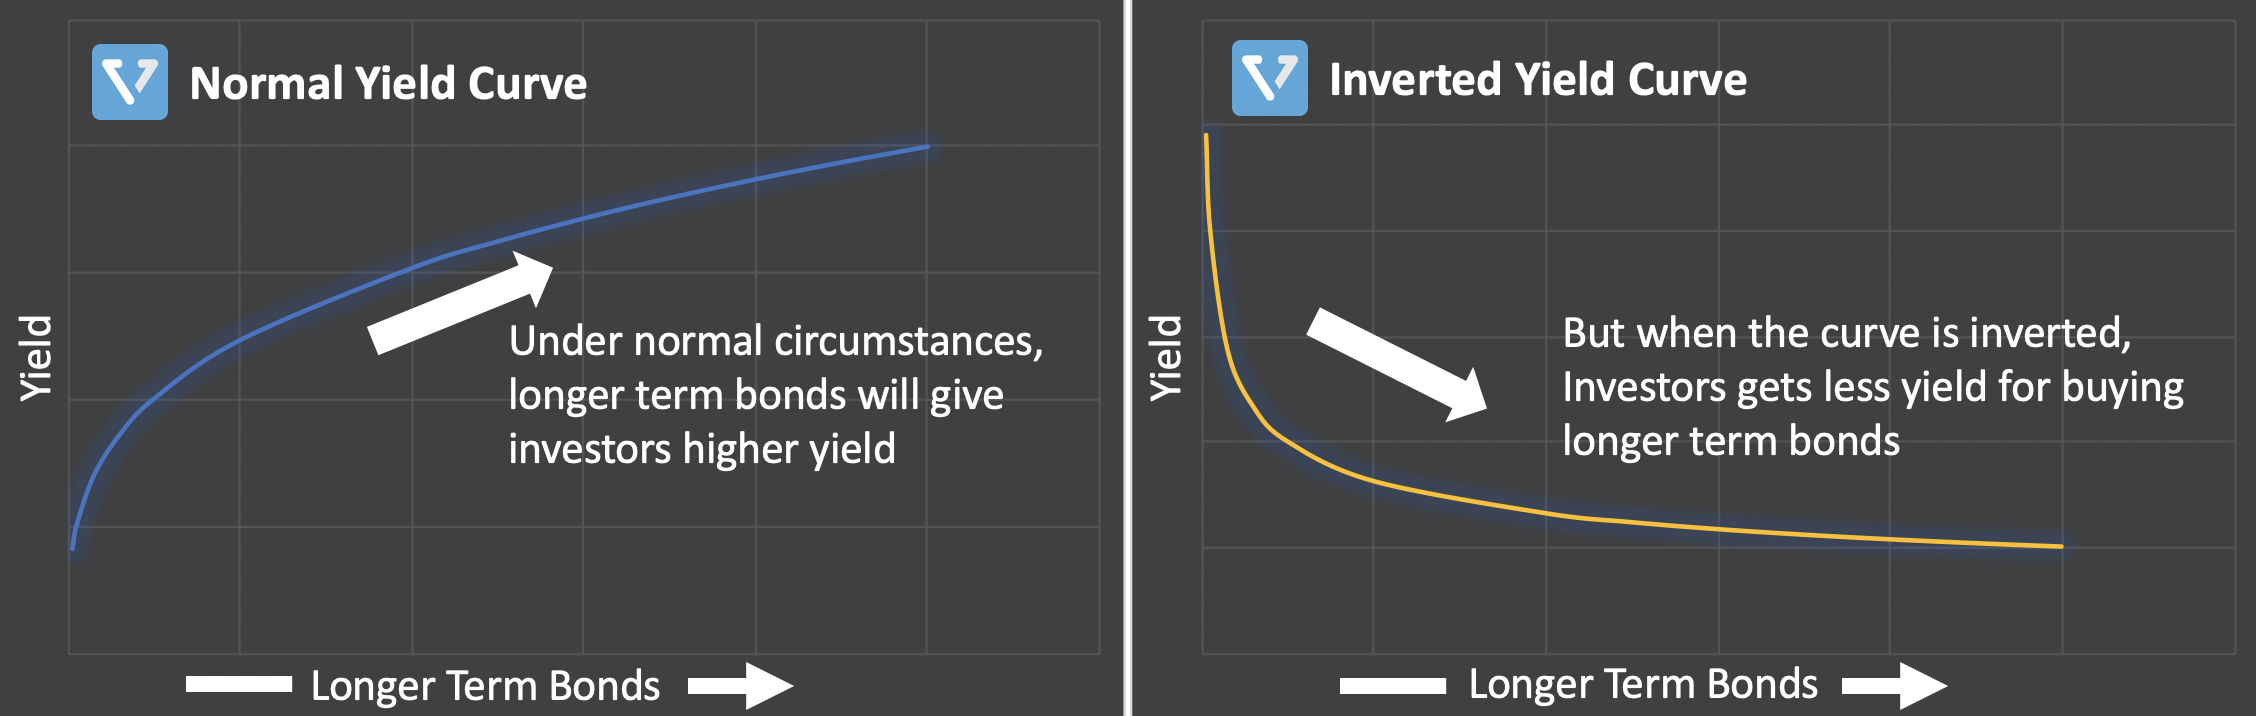
Figure 1: Normal Yield Curve vs. Inverted Yield Curve
What does Yield mean? When you, the investor, lend to another entity, you expect to get greater returns the longer the term of the loan is. When you buy US Treasury bonds, you are effectively lending to the US government. The amount of return you get from these bonds are signified by the yield. The higher the yield, the higher the returns you get. Under normal circumstances, the longer the term of the bond, the greater the yield you earn. Therefore, when you plot the Yield vs. Bond term, you have a curve that goes up to the right (see Figure 1 – left). As such, the yield difference between a longer term Treasury bond and shorter term is positive.
However, this is not always the case. Under certain circumstances, the opposite is true. Investors are rewarded with less yield for longer term bonds. When this happens, the yield curve is inverted (see Figure 1 – right). In such a case, the investor gets less return when lending money to the US government through long term bonds.
The yield curve inversion is commonly measured by the yield difference between the 10-year (long term) and the 3-month (short term) Treasury bonds. If the difference is negative, then the yield curve is inverted. This difference has been shown to be a powerful leading indicator for US recessions. When the yield difference is negative, studies have shown that a recession might be coming in two to six quarters.
Why does this inversion happen? When investors have a low sentiment on the short term prospects of the financial market, they tend to buy up long term US Treasury Bonds (which is the safest form of investment, as the US government has never defaulted on its debt), to avoid potential short term losses.
When more and more investors buy long term US bonds, the US Federal Reserve (the Fed) responds by lowering the yield (to balance the supply and demand). Conversely, when investors are not buying short term bonds, the Fed will increase the short term bond’s yield. This causes the yield difference to be negative.
What is the difference now? Currently, the difference is -30 points (one of the highest since April 2007). Figure 1 shows the difference between the interest rates on the 10-year Treasury and the 3-month Treasury bond from June 1976 to August 2019. Shaded areas indicate US recessions. From 1980 to 2019, there have been 5 recessions in the US, and each time, it is preceded by negative yield difference. If you are a financial wonk like we are, you can find the original paper (published in 1996).
A couple of caveats: Even though this indicator can be a powerful predictor of incoming recession, it is not 100% accurate. Also, it is still very difficult to know the timing of the recession. When the 1990 recession occurred, it started 17 months after the yield difference hits bottom. Similarly, the 2001 dot-com bubble and 2007 great recession, occurred 12 and 13 months, respectively, after the bottom.
Furthermore, it is very difficult to know when the yield difference has hit bottom. The bottom is only clearly visible on the chart after the fact.
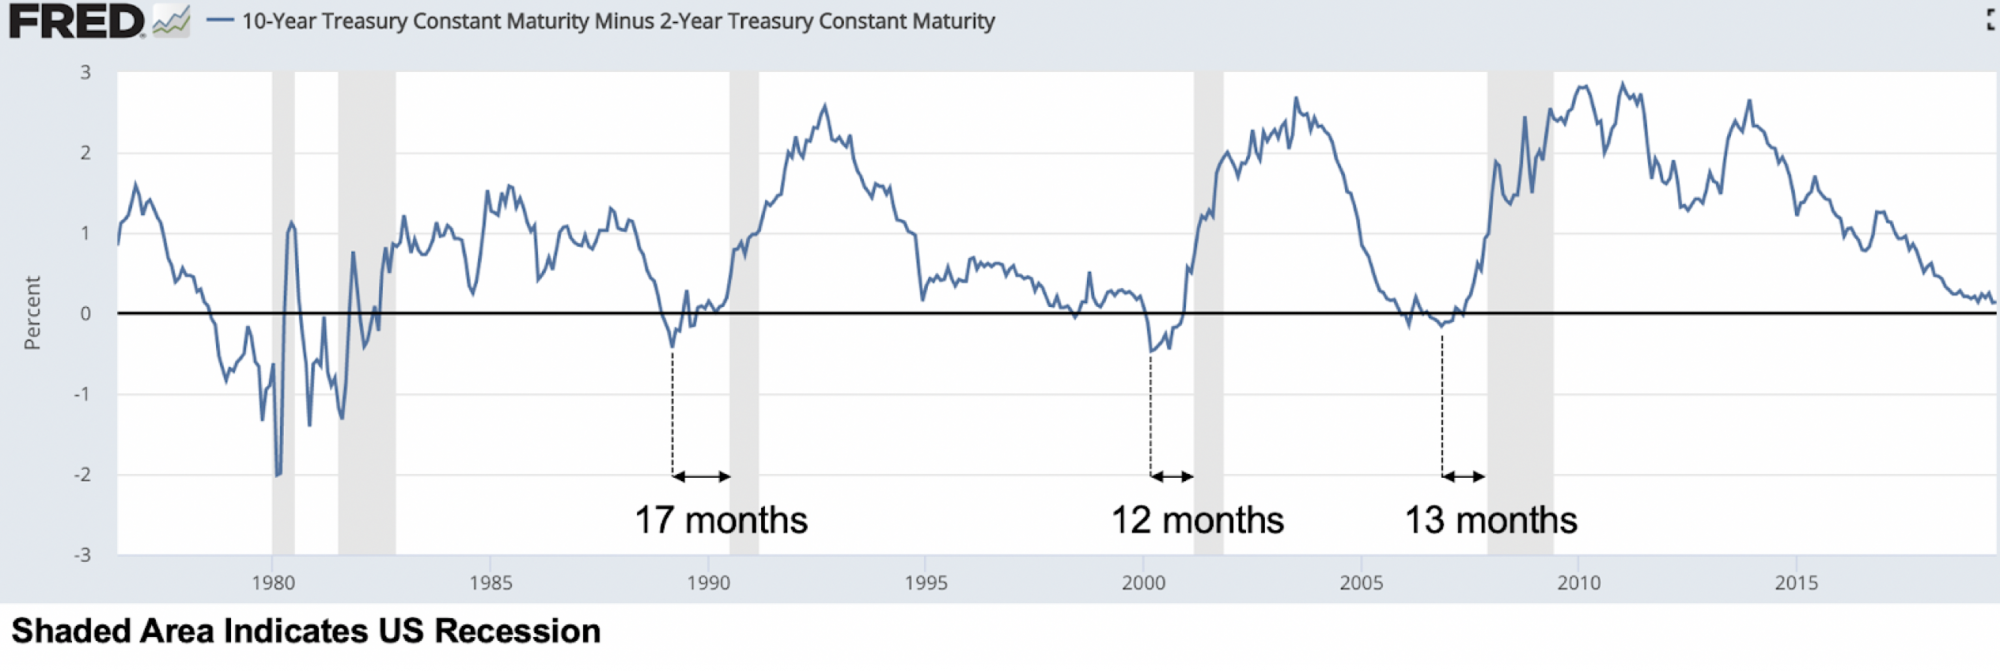
Figure 2: The difference between the interest rates on the 10-year Treasury and the 3-month Treasury bonds
So what’s an investor to do? The first instinct is to pull out of the market, and avoid the bottom and re-enter as the market is climbing back up. In other words, try to time the market. If an investor can avoid the worst days of the market and invest only when the market is growing, surely this will lead to spectacular performance. But how feasible is this?
Can you correctly predict the worst market days and avoid them? It is very attractive if we can avoid the worst trading days. If one can exclude the worst 90 days from 1963 to 1993 (7802 trading days), a $100 investment in 1963, would have returned $325.40. This is 14x higher than just investing and holding the S&P 500 over the same time period. Unfortunately, this is near impossible to do. For example, say an investor has a 70% chance of being able to correctly predict the performance of the market at any given day, the probability of this investor correctly identifying the 90 days out of 7802 trading days is effectively ZERO (probability = 0.7^7802.
The penalty of being wrong. Conversely, it has been shown that, during this same period, 90 trading days generated 95% of the period’s market gains. That is an average of just 3 days per year, or 1.2% of total days.
If you try to time the market and miss these best 90 days, your average annual return would have been 3.28% (about half of the return of Treasury Bills, the risk free investment option) and is much lower than had you not done anything and invested in the S&P 500 (which would have given you 7.09% annually). In other words, if you try to time the market and failed, during this 31 year period, you would have been exposed to the volatility and risk of the market, while halving your return.
What would Warren Buffett do? Warren Buffett often says Be fearful when others are greedy and greedy when others are fearful. (from his op-ed in NYT 2008 it’s well worth a read). In the aftermath of the 2007 2008 financial crisis, Buffett took the opportunity to invest in strong US companies at discounted valuation (as other investors were fleeing the equity market. At that time, he invested in GE and Goldman Sachs, as he viewed them to have strong balance sheets despite falling share prices. Nonetheless, he admitted that his purchase decision was 4 5 months early, as the market continued to plunge in 2009. But he was proven right in the long term.
So what have Warren Buffet and Berkshire Hathaway been doing? Hoarding cash it appears. The holding company, in its latest earnings release reported a record US $122 billion in cash. Further, it has not made any major acquisition in several years, and even reduced share repurchase in the latest quarter.
Note that, what Warren did is not for the faint of heart. It is very difficult for even a seasoned investor to invest when share prices are falling, especially when it is impossible to know when the bottom is. Further, Warren’s strategy may not be replicable as he gets access to unique deals that are not available to the public and is often the first call for unique opportunities.
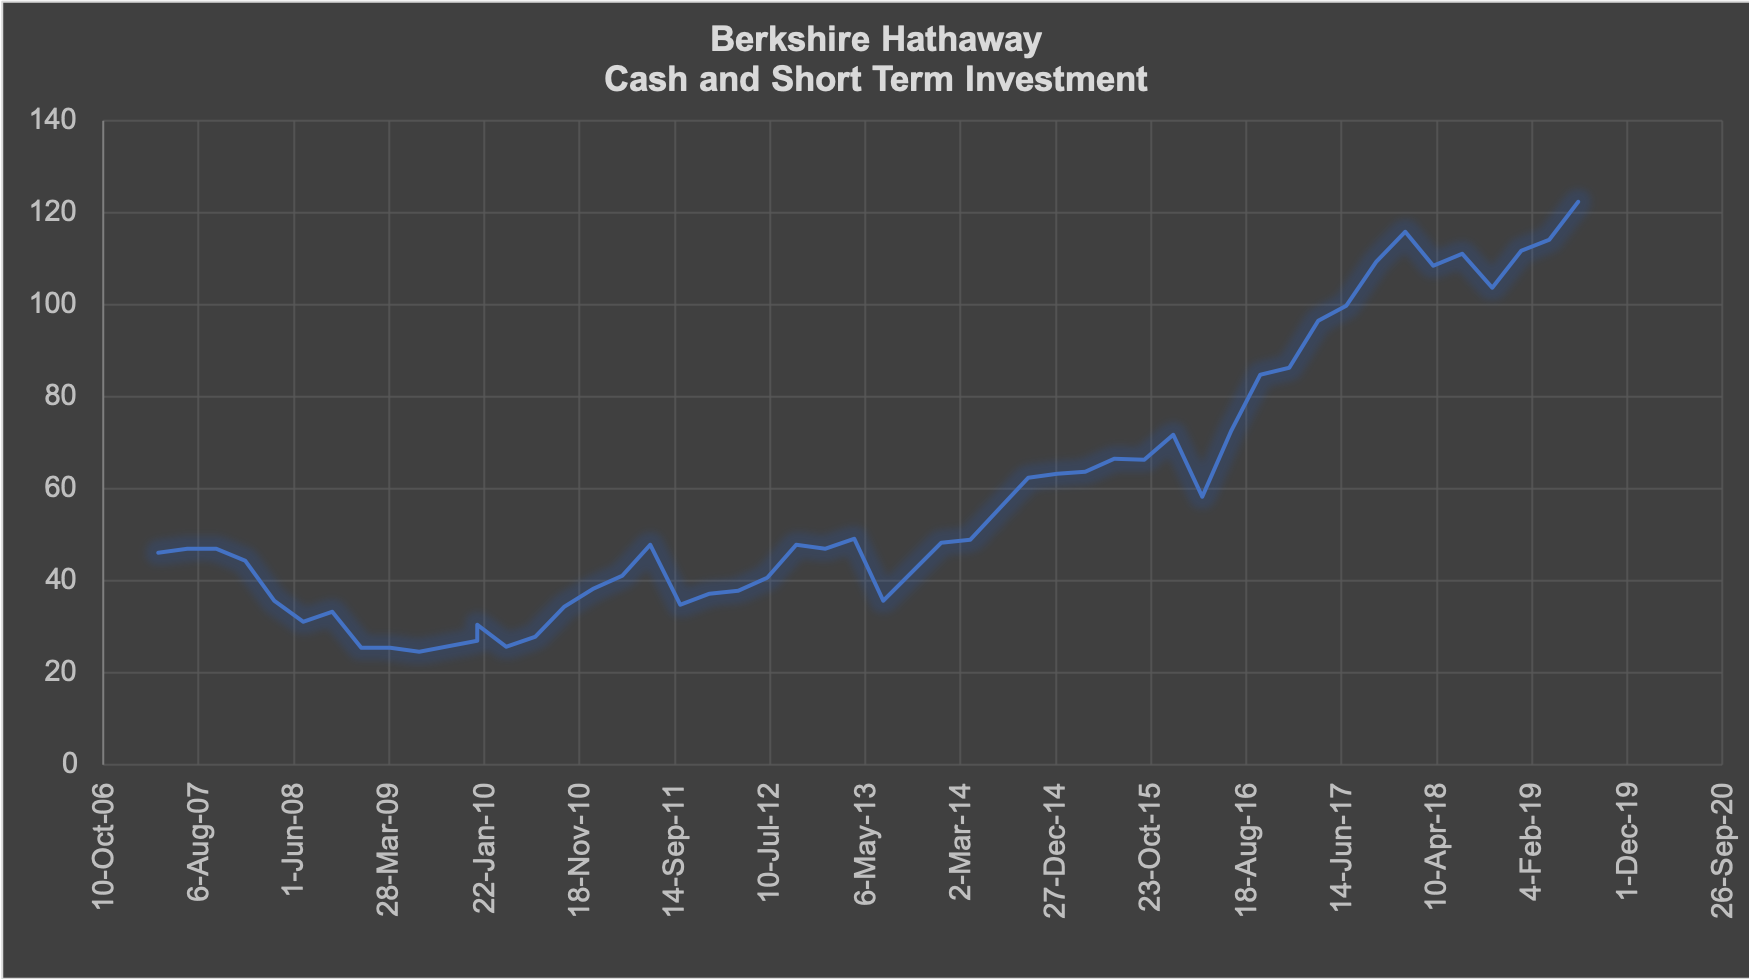
Figure 3: Berkshire Hathaway Cash and Short Term Investment
So, what’s the prudent thing to do? If timing the market in the long run is impossible, then the best thing to do is to invest with a long term horizon. If the investor would like to minimize losses during adverse market conditions, constructing a well diversified portfolio in multiple asset classes (stocks, real estate, precious metals and treasury bonds) might be the prudent thing to do. In future newsletters, we will share some of these portfolios with you.
